Overview
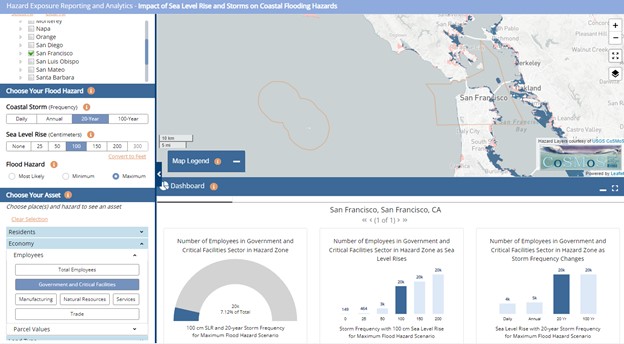
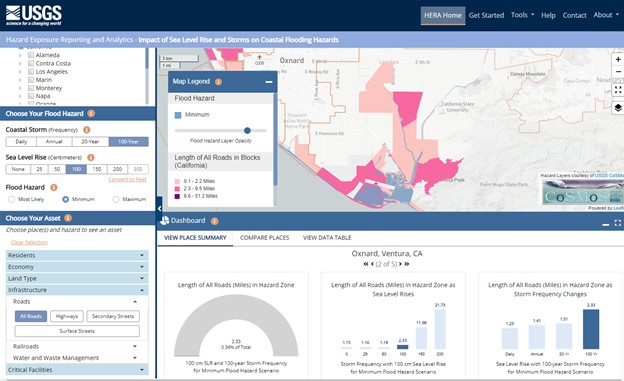
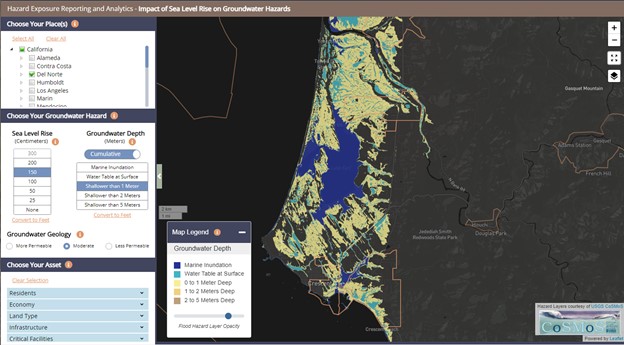
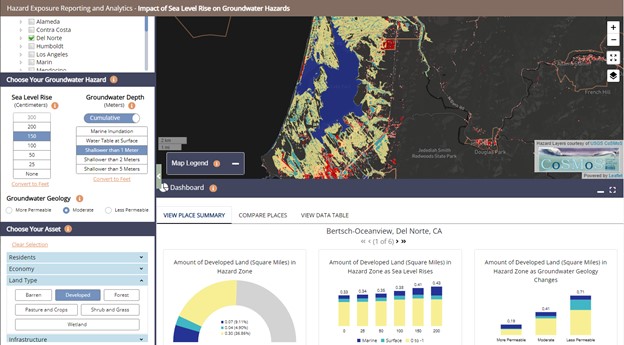
These tools were developed to provide users with insight on potential population, economic, land cover, and infrastructure vulnerability resulting from a given hazard. Interactive maps and graphics allow users to examine hazard exposure for individual communities, compare exposure for multiple communities, and see changes in hazard exposure. The Coastal Flooding Tool looks at the potential effects of sea level rise and storms on coastal flooding, either individually or as combined effects. The Coastal Groundwater Tool looks at the potential effects of sea level rise on groundwater depths.
Features
- Estimate the number of people and amount of infrastructure and facilities that are in hazard zones
- Communicate community exposure to hazards through map viewers and data dashboards
- Get information at the incorporated and unincorporated place level as well as county totals
Additional Information
Data
Tool Screenshots